Q19 / 75 · JEE Main 2025 (24 Jan Shift 1) · Chemistry
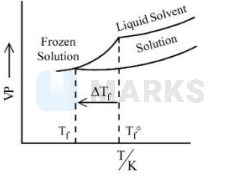
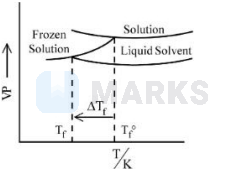
Consider the given plots of vapour pressure (VP) vs temperature(T/K). Which amongst the following options is correct graphical representation showing $\Delta \mathrm{T}_{\mathrm{f}}$, depression in the freezing point of a solvent in a solution?
- Correct answerA
- B
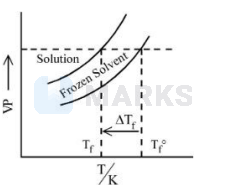
- C
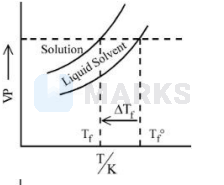
- D
Solution
On adding non-volatile solute in a solvent, the freezing point of solution decreases.
$\mathrm{T}_{\mathrm{f}} < \mathrm{T}_{\mathrm{f}}^0$
F.P. of solution $ < $ F.P. of pure solvent
Also V.P. of solution decreases on adding nonvolatile solute in a solvent.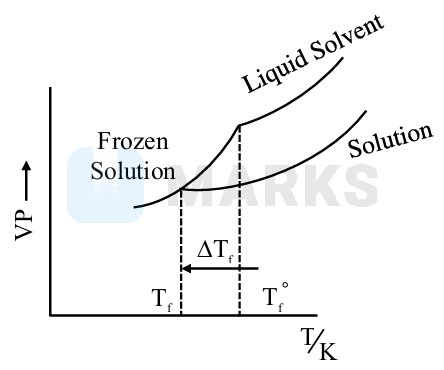
Hence, the correct answer is option: 'A'.