Q84 / 90 · KVPY 2010 (SB/SX) · Physics
Consider a uniform spherical volume charge distribution of radius $R$. Which of the following graphs correctly represents the magnitude of the electric field $\mathrm{E}$ as a distance $\mathrm{r}$ from the center of the sphere?
- Correct answerA

- B
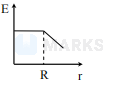
- C

- D
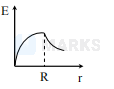
Solution

$$ \begin{array}{l} E_{r}=\frac{\rho r}{3 E_{0}} \text { for } 0 \leq r < R \\ E_{r}=\frac{k Q}{r^{2}} \text { for } r \geq R \end{array} $$ $\therefore \mathrm{E} \propto \mathrm{r}$ for $\mathrm{r} < \mathrm{R}$ and $\mathrm{E} \propto \frac{1}{\mathrm{r}^{2}}$ for $\mathrm{r} \geq \mathrm{R}$ $\therefore$ curve is
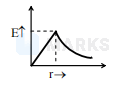
Hence, the correct answer is option: 'A'.