Q3 / 75 · JEE Main 2026 (22 January Shift 1) · Chemistry
Consider a solution of $\mathrm{CO}_{2}(\mathrm{~g})$ dissolved in water in a closed container. Which one of the following plots correctly represents variation of log (partial pressure of $\mathrm{CO}_{2}$ in vapour phase above water) $[y$-axis] with $\log$ (mole fraction of $\mathrm{CO}_{2}$ in water) $[x$-axis $]$ at $25^{\circ} \mathrm{C}$ ?
- A
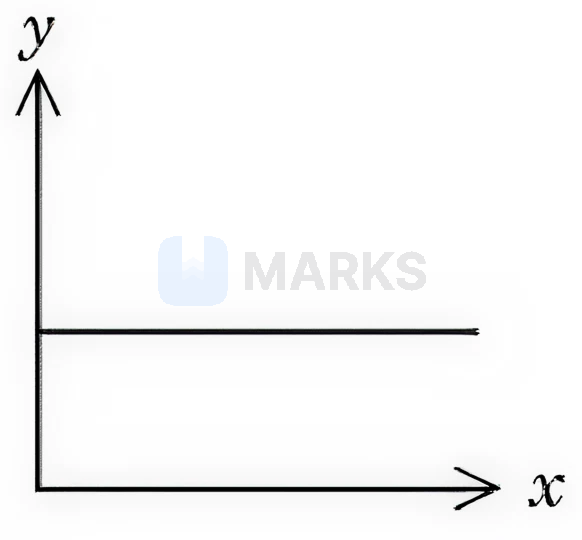
- Correct answerB
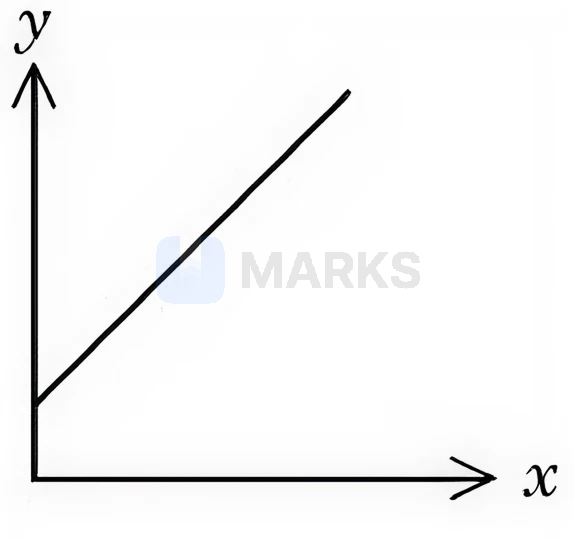
- C
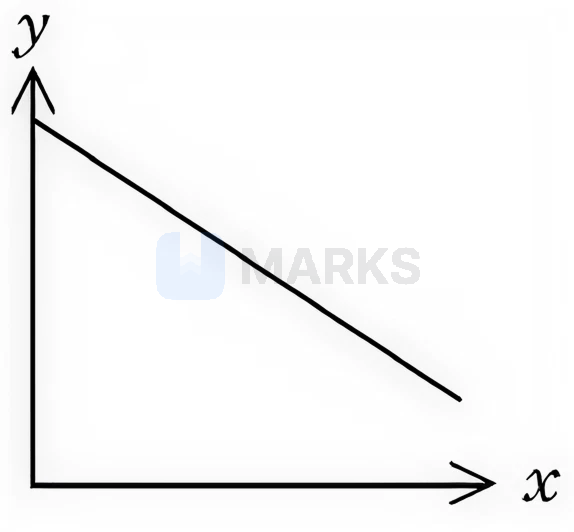
- D
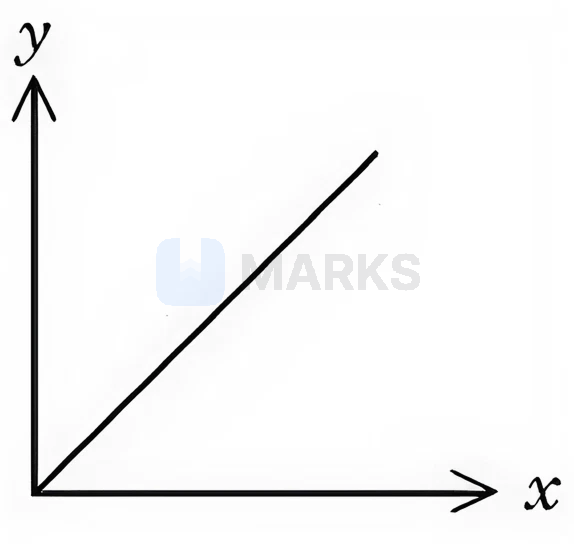
Solution
According to Henry's Law, the partial pressure of a gas in the vapour phase ($p$) is proportional to the mole fraction of the gas in the solution ($x$).
The mathematical expression is: $p = K_H \cdot x$
where $K_H$ is the Henry's law constant.
Taking logarithm on both sides:
$\log(p) = \log(K_H \cdot x)$
$\log(p) = \log(K_H) + \log(x)$
Comparing this with the equation of a straight line $y = mx + c$:
$y = \log(p)$ (y-axis)
$x = \log(x)$ (x-axis)
$m = 1$ (slope)
$c = \log(K_H)$ (y-intercept)
Since $K_H$ for $CO_2$ in water is a positive constant at $25^{\circ}C$, $\log(K_H)$ will be a constant intercept.
The plot of $\log(p)$ vs $\log(x)$ is a straight line with a positive slope and a positive y-intercept.
This corresponds to graph (2).
Hence, the correct answer is option: 'B'.