Q36 / 79 · NEST (NISER) 2026 · Chemistry
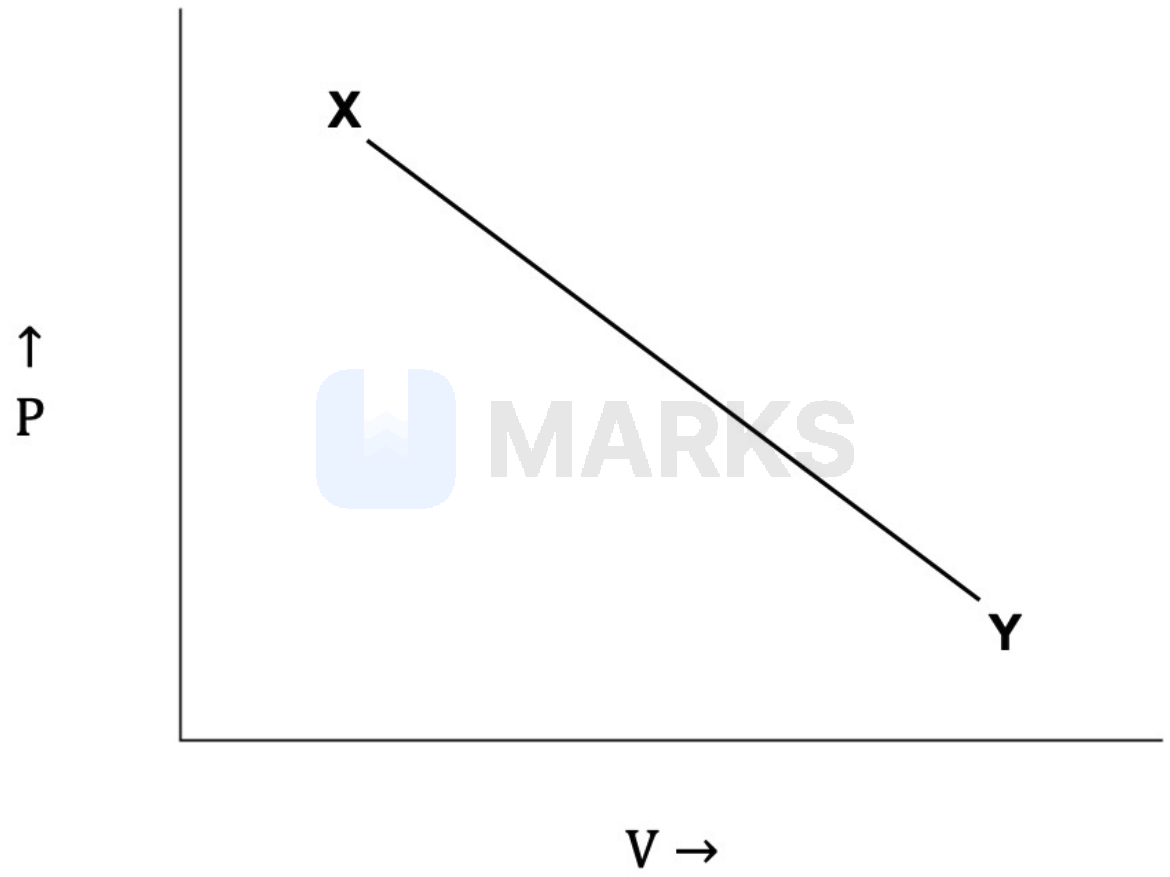
Consider a reversible thermodynamic process involving one mole of ideal gas represented by a line on the $P-V$ diagram connecting two states X ($4$ bar, $1$ L, $T_1$) and Y ($1$ bar, $2$ L, $T_2$) as shown in the figure:
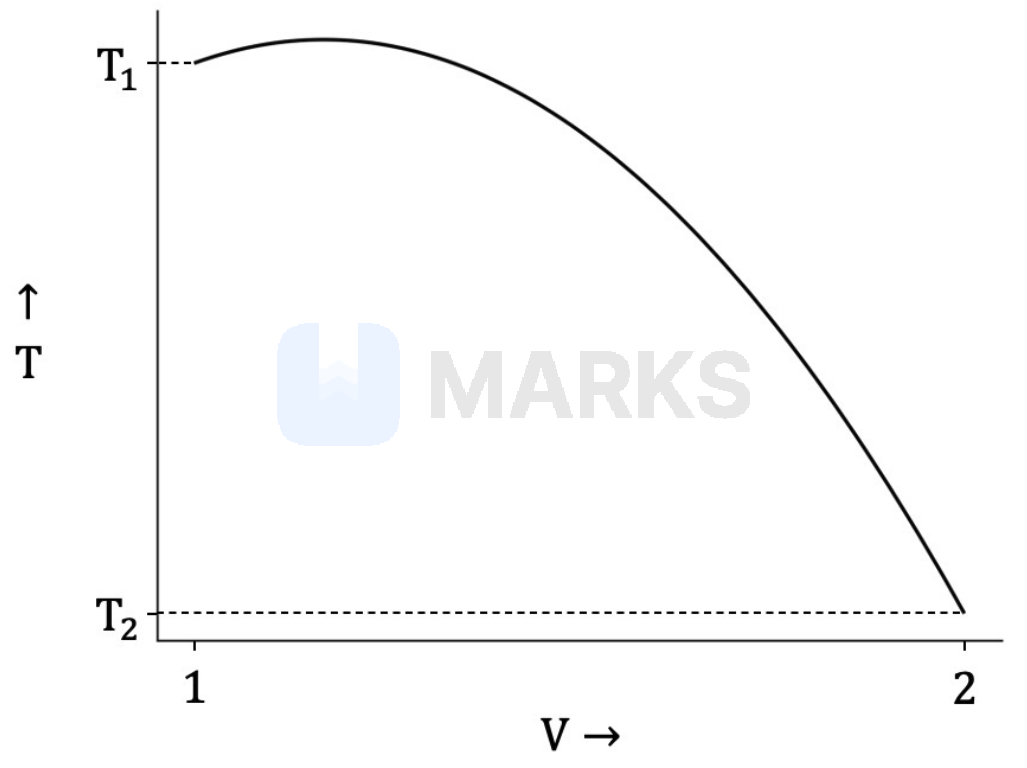
During the process the change in temperature (in K) as a function of volume (in L) is best represented as:
During the process the change in temperature (in K) as a function of volume (in L) is best represented as:
- A
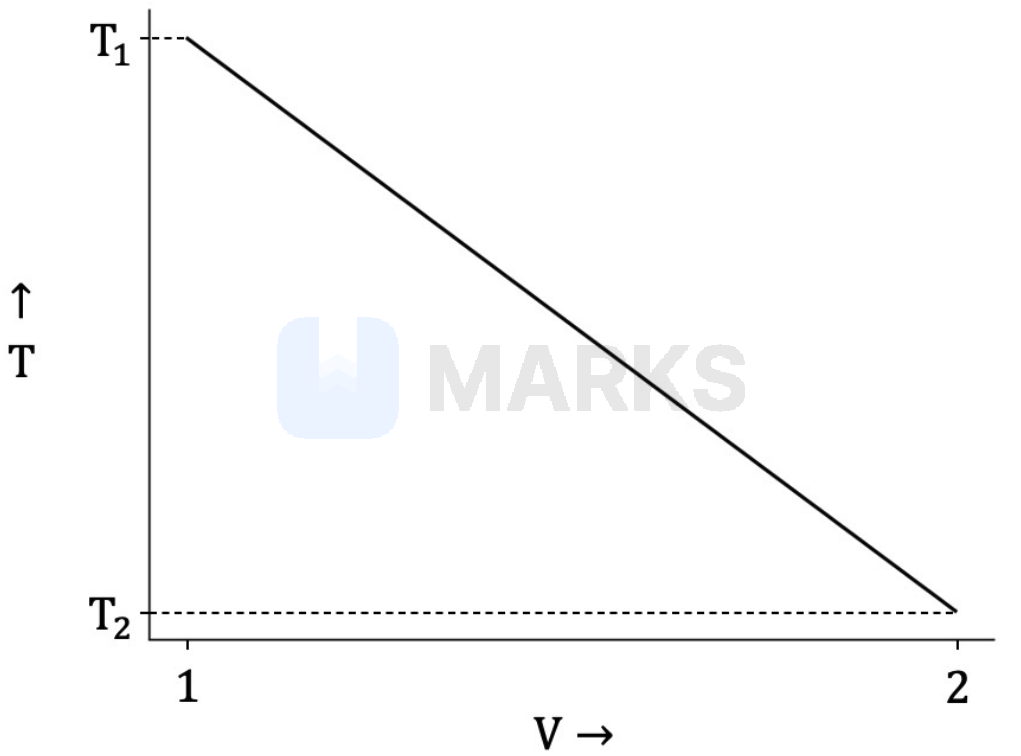
- B
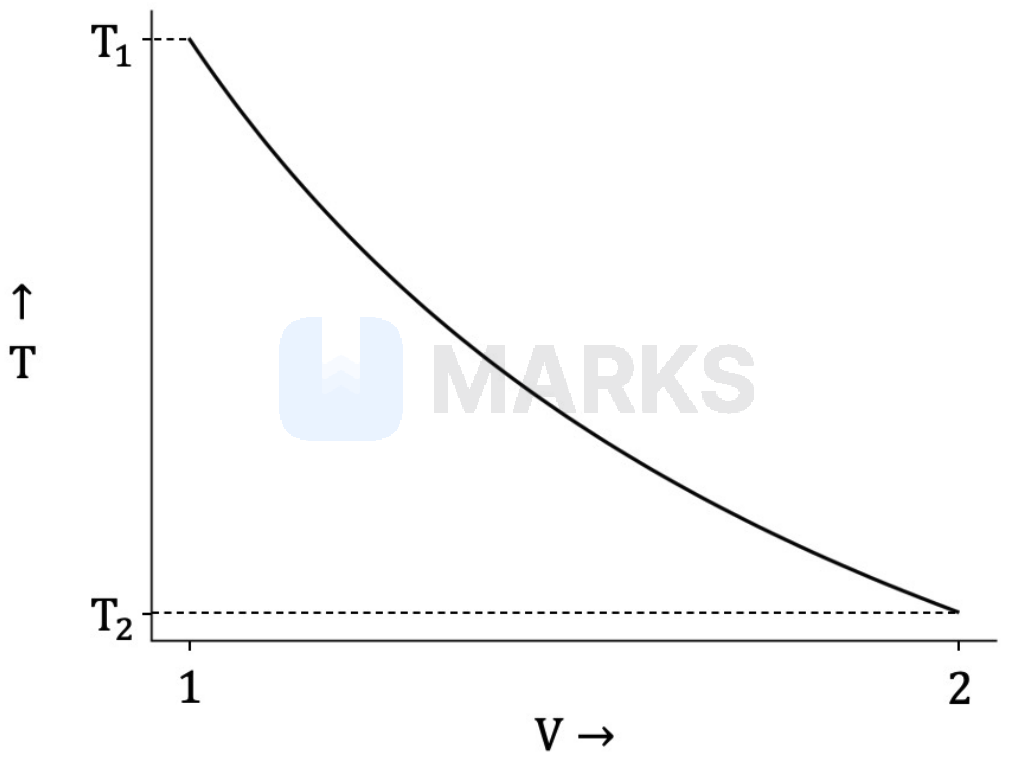
- C
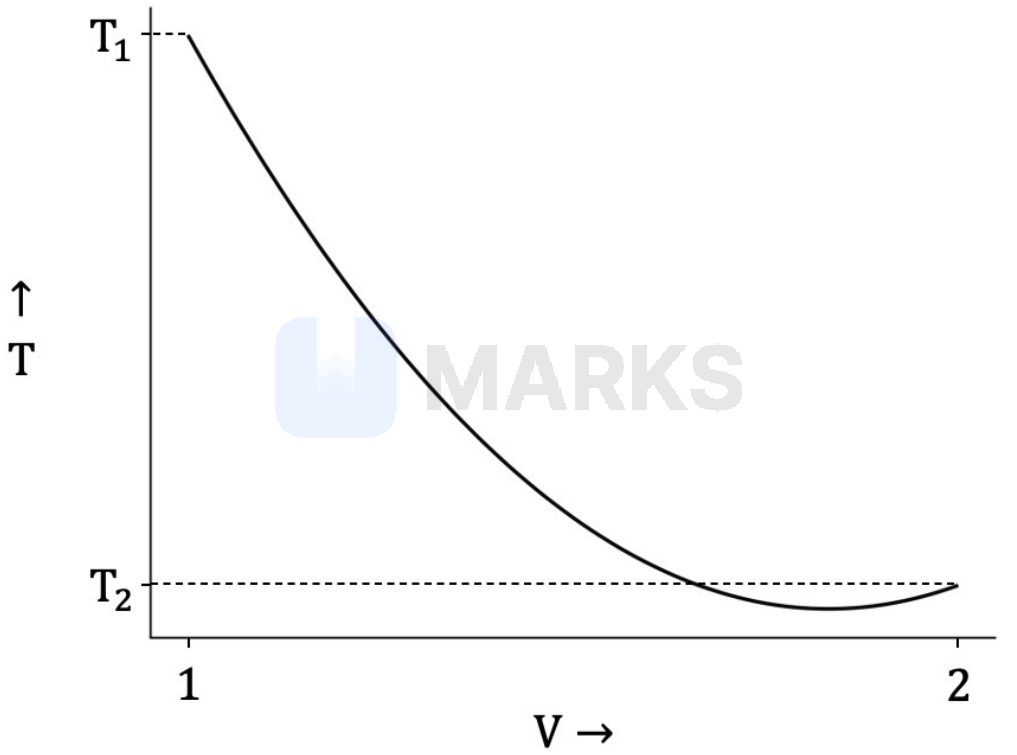
- Correct answerD
Solution
The process is represented by a straight line in the $P-V$ diagram passing through the points $(1, 4)$ and $(2, 1)$.
The equation of this line is given by $P - P_1 = \dfrac{P_2 - P_1}{V_2 - V_1}(V - V_1)$.
Substituting the values, we get:
$P - 4 = \dfrac{1 - 4}{2 - 1}(V - 1)$
$P - 4 = -3(V - 1) \Rightarrow P = -3V + 7$
For one mole of an ideal gas, the equation of state is $PV = RT$.
Substituting the expression for $P$, we obtain the temperature $T$ as a function of $V$:
$(-3V + 7)V = RT \Rightarrow T = \dfrac{1}{R}(7V - 3V^2)$
This represents a downward-opening parabola in the $T-V$ plane.
To find the volume at which the temperature is maximum, we set $\dfrac{dT}{dV} = 0$:
$\dfrac{dT}{dV} = \dfrac{1}{R}(7 - 6V) = 0 \Rightarrow V = \dfrac{7}{6}\text{ L}$
Since $V = \dfrac{7}{6}\text{ L} \approx 1.167\text{ L}$ lies within the given interval $1 \le V \le 2$, the temperature will first increase from $V = 1$ to reach a maximum, and then decrease.
Evaluating the temperatures at the endpoints:
At $V = 1\text{ L}$, $T_1 = \dfrac{1}{R}(7(1) - 3(1)^2) = \dfrac{4}{R}$
At $V = 2\text{ L}$, $T_2 = \dfrac{1}{R}(7(2) - 3(2)^2) = \dfrac{14 - 12}{R} = \dfrac{2}{R}$
Thus, $T_1 > T_2$.
The curve that shows an initial increase to a maximum followed by a decrease, with $T_1 > T_2$, corresponds to option (4).
Answer :
Hence, the correct answer is option: 'D'.