Q52 / 200 · NEET 2021 · Chemistry
Choose the correct option for graphical representation of Boyle's law, which shows a graph of pressure vs. volume of a gas at different temperatures:
Choose the correct option for graphical representation of Boyle's law, which shows a graph of pressure vs. volume of a gas at different temperatures:
- A
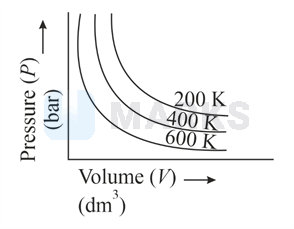
- B
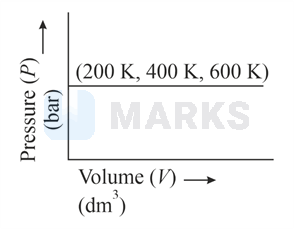
- C
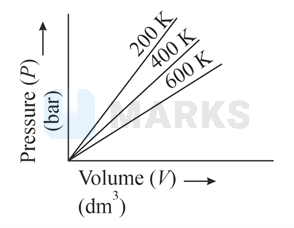
- Correct answerD
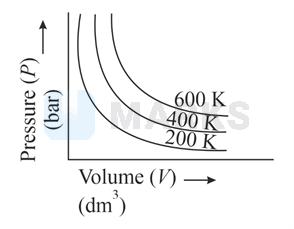
Solution
According to Boyle's law
constant ( and constant)
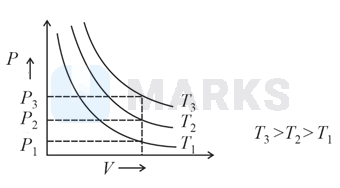
for any fixed volume
Therefore,
Hence, the correct answer is option: 'D'.