Q80 / 90 · JEE Main 2015 (04 Apr) · Physics
An LCR circuit is equivalent to a damped pendulum. In an LCR circuit the capacitor is charged to and then connected to the L and R as shown below:
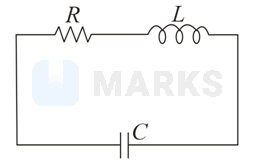
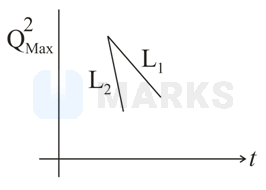
If a student plots graphs of the square of maximum charge on the capacitor with time (t) for two different values and of L then which of the following represents this graph correctly? (plots are schematic and not drawn to scale)
If a student plots graphs of the square of maximum charge on the capacitor with time (t) for two different values and of L then which of the following represents this graph correctly? (plots are schematic and not drawn to scale)
- A
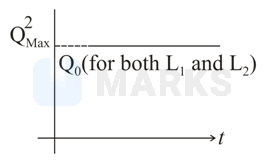
- B
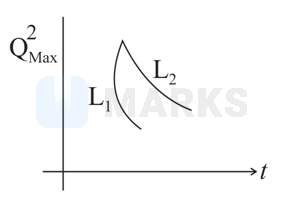
- Correct answerC
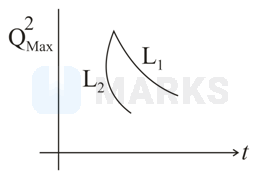
- D
Solution
Comparing to the damped pendulum. We write, , is resistive force, Amplitude, . Comparing results, we can write
, as charge decreasing,
.
Exponentially decreasing function, graph has higher values than .
, as charge decreasing,
.
Exponentially decreasing function, graph has higher values than .
Hence, the correct answer is option: 'C'.