Q25 / 56 · IAT (IISER) 2026 · Chemistry
An ideal gas goes through a reversible isothermal expansion (solid line) followed by a reversible adiabatic expansion (dashed line). Which of the following diagram(s) closely depict(s) the entire process?
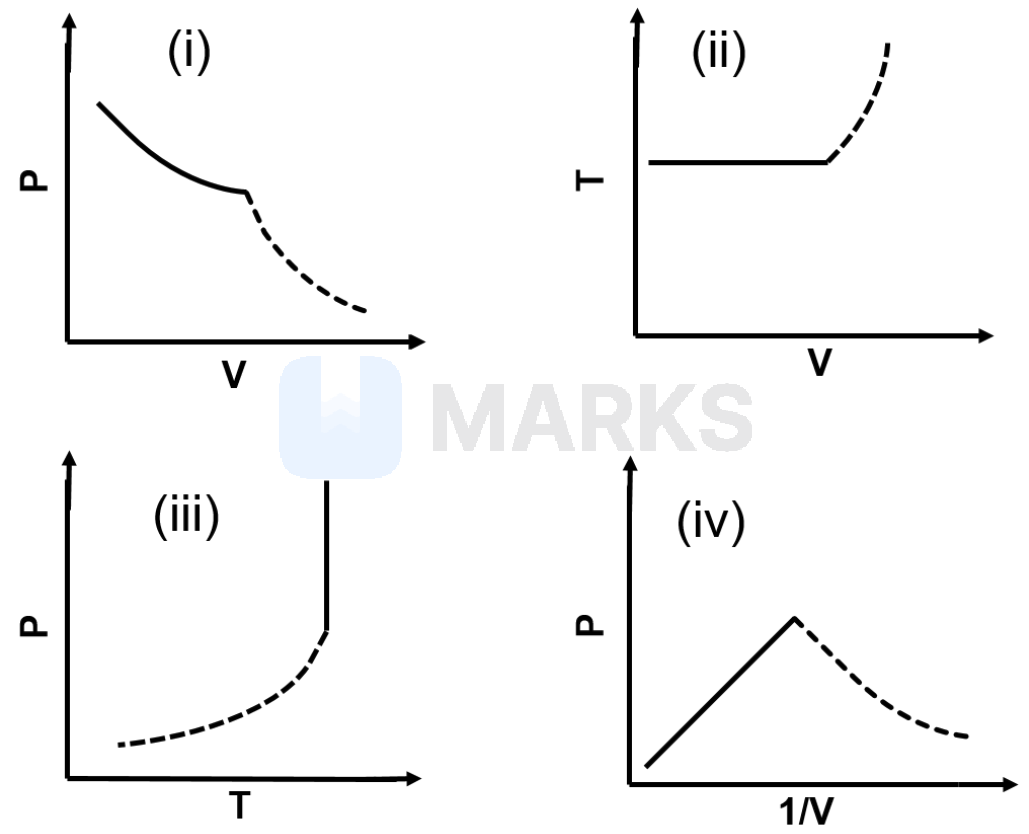
- A(ii) and (iv) only
- B(i) only
- C(i), (ii), and (iii) only
- Correct answerD(i) and (iii) only
Solution
Let us analyze the two processes given in the problem:
1. Reversible isothermal expansion (solid line):
Temperature $T$ remains constant. As the gas expands, volume $V$ increases and pressure $P$ decreases.
Equation: $PV = \text{constant}$ or $P \propto \dfrac{1}{V}$.
2. Reversible adiabatic expansion (dashed line):
No heat is exchanged ($q = 0$). As the gas expands, it does work at the expense of its internal energy, so temperature $T$ decreases. Volume $V$ increases and pressure $P$ decreases.
Equation: $PV^{\gamma} = \text{constant}$ and $T^{\gamma} P^{1-\gamma} = \text{constant}$.
Now, let us evaluate each diagram:
Diagram (i): $P$ vs $V$
The solid line shows $P$ decreasing as $V$ increases, which is a rectangular hyperbola for an isothermal process. The dashed line shows further expansion. Since the slope of an adiabatic curve ($\dfrac{dP}{dV} = -\gamma \dfrac{P}{V}$) is steeper than that of an isothermal curve ($\dfrac{dP}{dV} = -\dfrac{P}{V}$), the dashed line must fall more steeply than the continuation of the solid line. Diagram (i) correctly depicts this.
Diagram (ii): $T$ vs $V$
The solid line is horizontal, correctly showing constant $T$ as $V$ increases. However, for the adiabatic expansion (dashed line), $T$ should decrease as $V$ increases. The diagram incorrectly shows $T$ increasing.
Diagram (iii): $P$ vs $T$
The solid line is vertical and goes downwards, correctly showing $P$ decreasing at constant $T$. For the adiabatic expansion, $P \propto T^{\dfrac{\gamma}{\gamma-1}}$. Since $\gamma > 1$, the exponent $\dfrac{\gamma}{\gamma-1} > 1$. This means as $T$ decreases, $P$ decreases, and the curve $P(T)$ is concave upwards ($\dfrac{d^2P}{dT^2} > 0$). The dashed line correctly goes left (decreasing $T$) and down (decreasing $P$) with an upward concavity.
Diagram (iv): $P$ vs $1/V$
For an isothermal expansion, $V$ increases, so $1/V$ decreases. The process should move towards the origin along a straight line $P = nRT(1/V)$. The diagram shows the solid line and dashed line meeting at a peak, with the dashed line located at higher values of $1/V$ (lower $V$). This would imply a compression rather than an expansion, making it incorrect.
Therefore, only diagrams (i) and (iii) closely depict the entire process.
Answer: (i) and (iii) only
Hence, the correct answer is option: 'D'.