Q43 / 60 · NEST (NISER) 2016 · Mathematics
Among the following equations the one that most accurately describes the graph shown below is
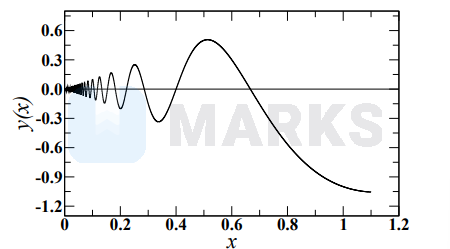
- A$y=x \sin \frac{\pi}{x} ; \quad 0 \lt x \lt 1$
- Correct answerB$y=x \cos \frac{\pi}{x} ; \quad 0 \lt x \lt 1$
- C$y=\frac{1}{x} \sin (\pi x) ; \quad 0 \lt x \lt 1$
- D$y=\frac{1}{x} \cos (\pi x) ; \quad 0 \lt x \lt 1$
Hence, the correct answer is option: 'B'.