Q56 / 180 · COMEDK 2024 (Morning Shift) · Chemistry
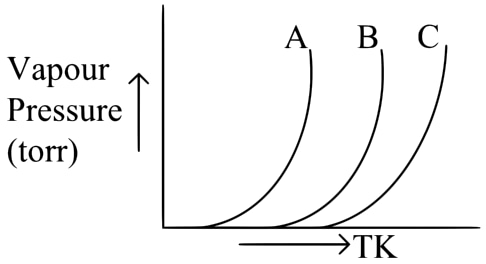 Above figure represents Vapour pressure versus Temperature graphs of 2 pure volatile liquids and a solution formed by the 2 liquids.
(i) Which curve represents the solution?
(ii) Which curve represents the liquid with the strongest intermolecular forces of attraction?
Above figure represents Vapour pressure versus Temperature graphs of 2 pure volatile liquids and a solution formed by the 2 liquids.
(i) Which curve represents the solution?
(ii) Which curve represents the liquid with the strongest intermolecular forces of attraction?- A(i) B (ii) A
- B(i) A (ii) C
- C(i) C (ii) A
- Correct answerD(i) B (ii) C
Solution
The vapour pressure of a solution containing two volatile liquids is always intermediate between the vapour pressures of the two pure components at a given temperature. In the graph, curve A represents the liquid with the highest vapour pressure (weakest intermolecular forces), curve C represents the liquid with the lowest vapour pressure (strongest intermolecular forces), and curve B represents the solution formed by these two liquids.
Therefore, (i) curve B represents the solution, and (ii) curve C represents the liquid with the strongest intermolecular forces of attraction.
Answer: (i) B (ii) C
Therefore, (i) curve B represents the solution, and (ii) curve C represents the liquid with the strongest intermolecular forces of attraction.
Answer: (i) B (ii) C
Hence, the correct answer is option: 'D'.