Q266 / 270 · NDA 2016 (Phase 2) · Mathematics
A random sample of 20 people is classified in the following table according to their ages:
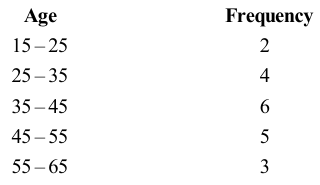
What is the mean age of this group of people?
What is the mean age of this group of people?
- A$41.0$
- Correct answerB$41.5$
- C$42.0$
- D$42.5$
Solution
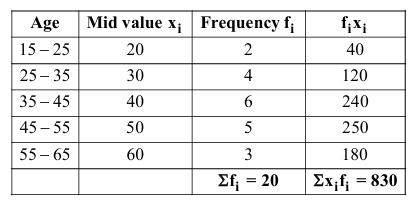
$\Rightarrow$ Mean age $=\frac{\Sigma x_i f_i}{\Sigma f_i}=\frac{836}{20}=41.5$
Hence, the correct answer is option: 'B'.