Q34 / 125 · BITSAT 2017 · Chemistry
A graph is plotted between log versus for calculation of activation energy . The correct plot is
A graph is plotted between log versus for calculation of activation energy . The correct plot is
- A

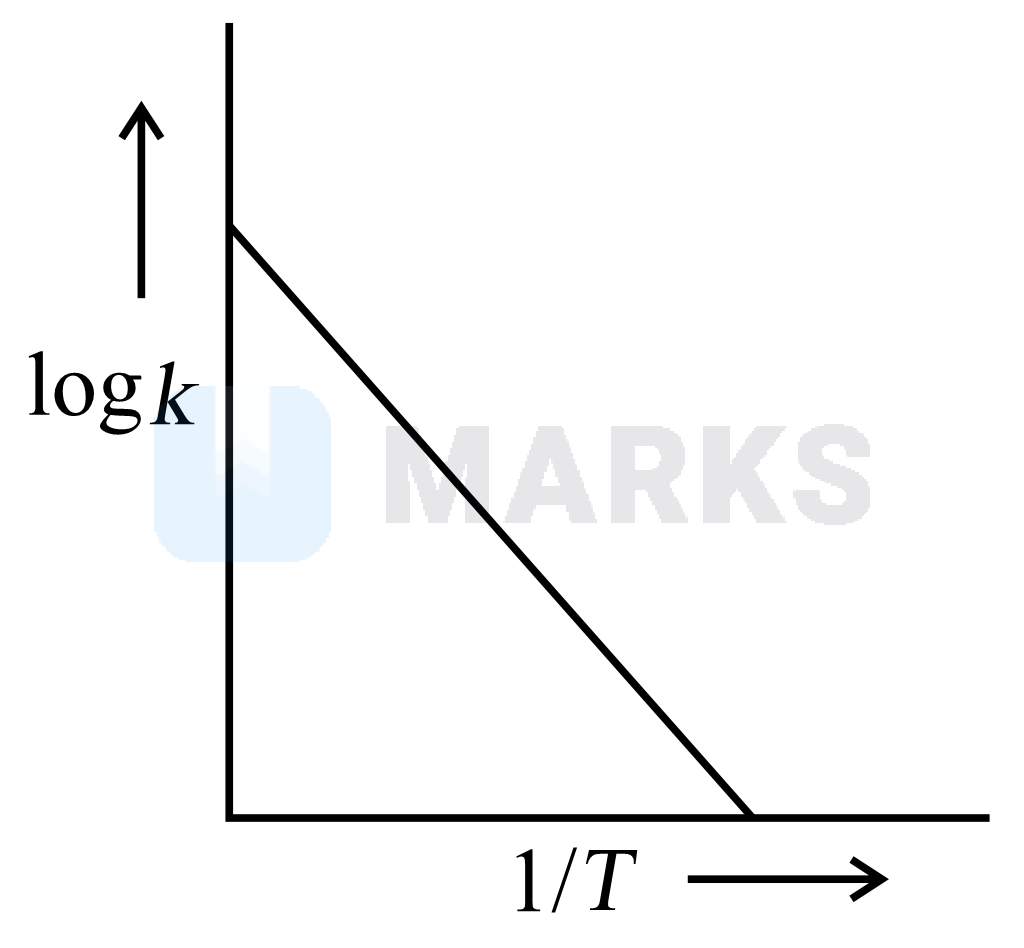
- Correct answerB
- C
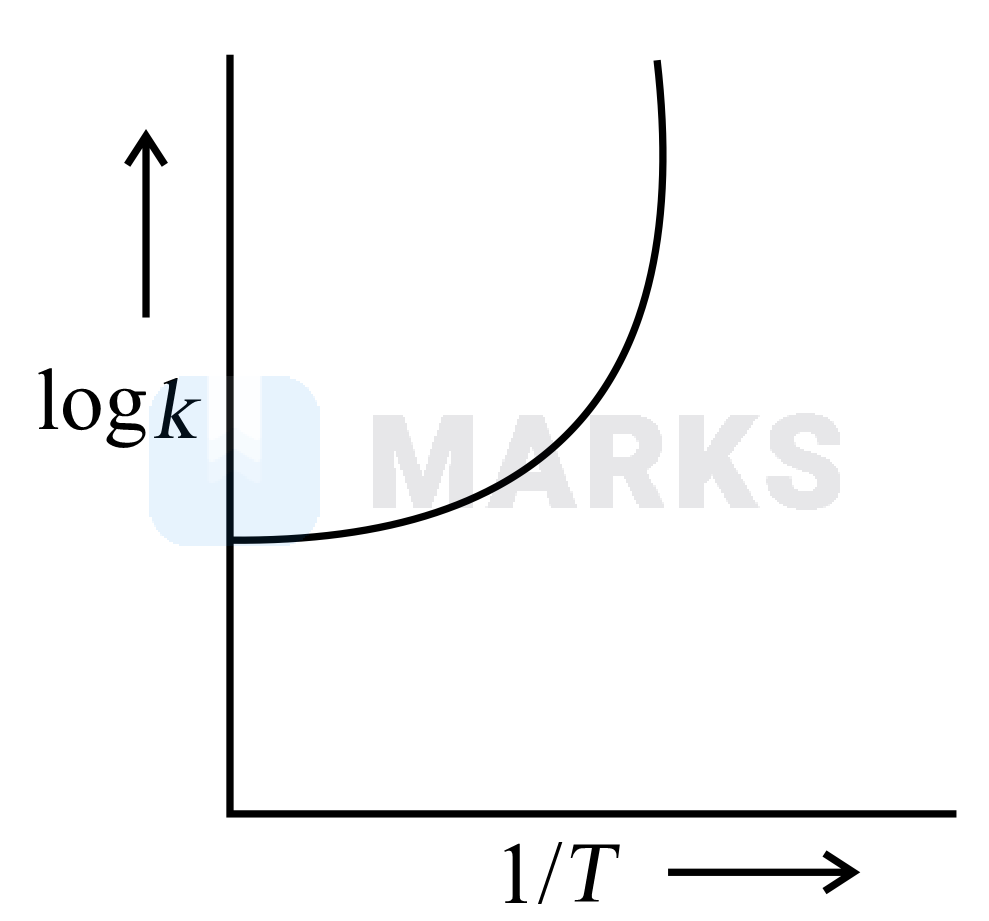
- D
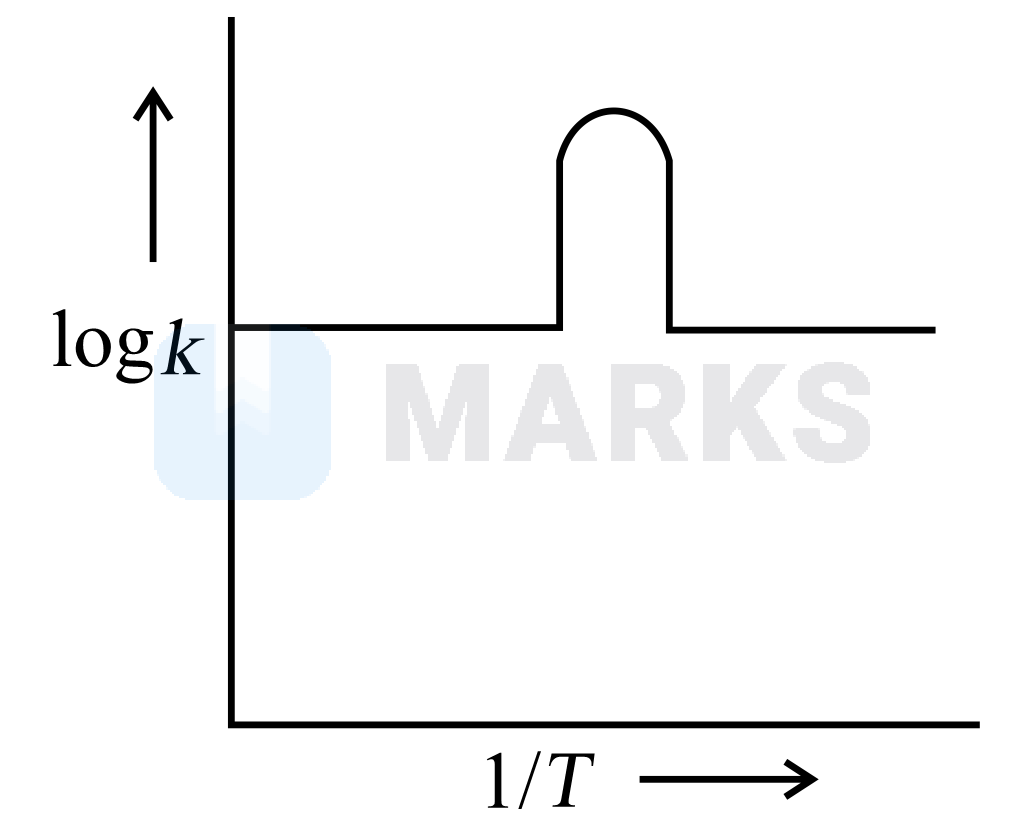
Solution
According to Arrhenius equation,
and
, the equation of straight line
The value of log should increase uniformily with or decrease with .
From this, that the slope is negative, which means that angle with x - axis is greater than 90° also that the point on which the straight line of graph intercepts the y - axis is log A which is positive.
Hence all the conclusions point out towards option b as it has negative slope and a positive y intercept.
Hence, the correct answer is option: 'B'.