Q114 / 180 · NEET 2026 (Re-NEET) · Physics
A conducting loop of finite resistance lies on the $x$-$y$ plane. There is a constant magnetic field in the $z$ direction. The area of the loop varies with time $t$, as $A=A_0(1+\sin t)$ in appropriate units. The figure that correctly indicates the qualitative behaviour of the power $P$ dissipated in the loop as a function of time is :
- A
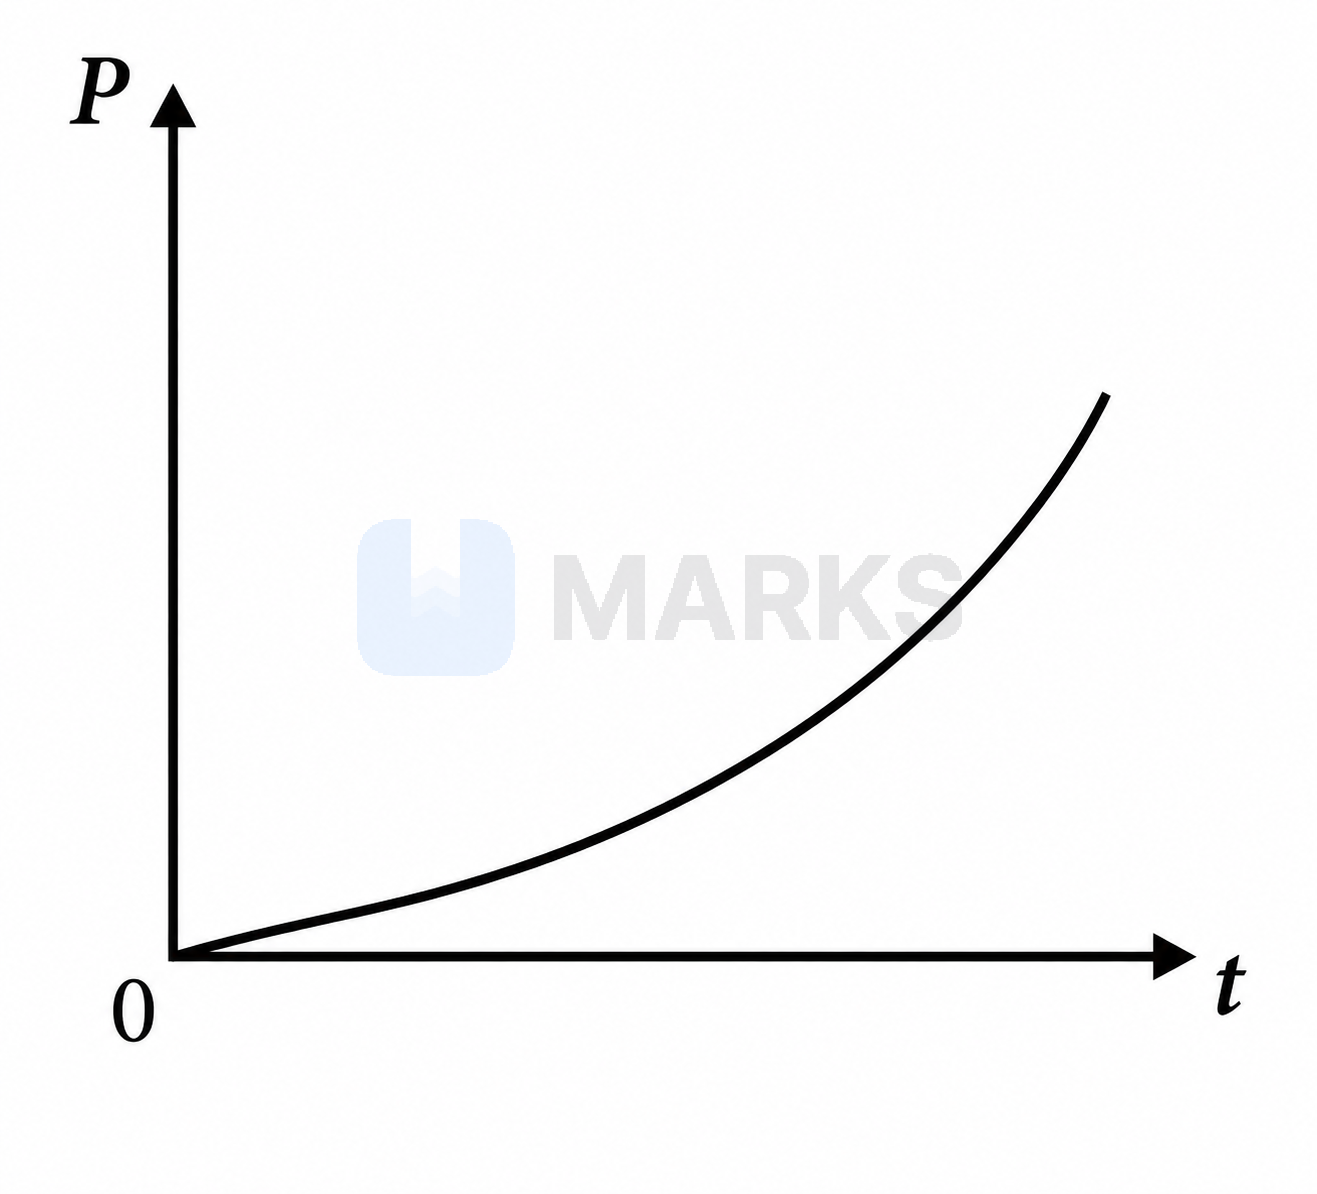
- B
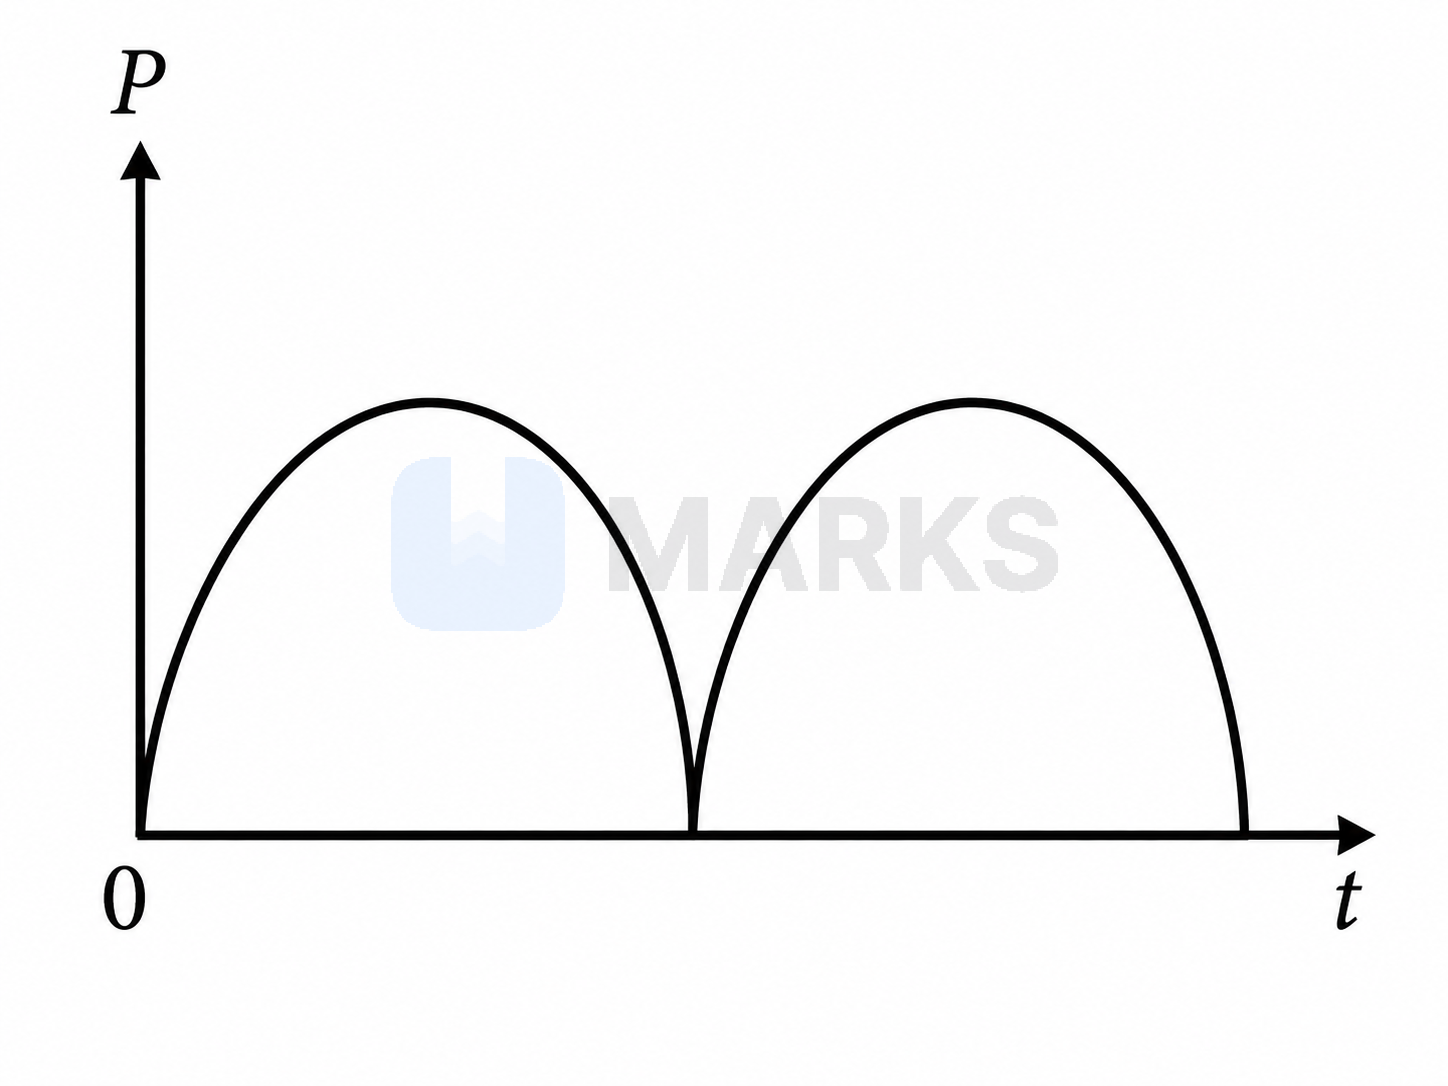
- Correct answerC
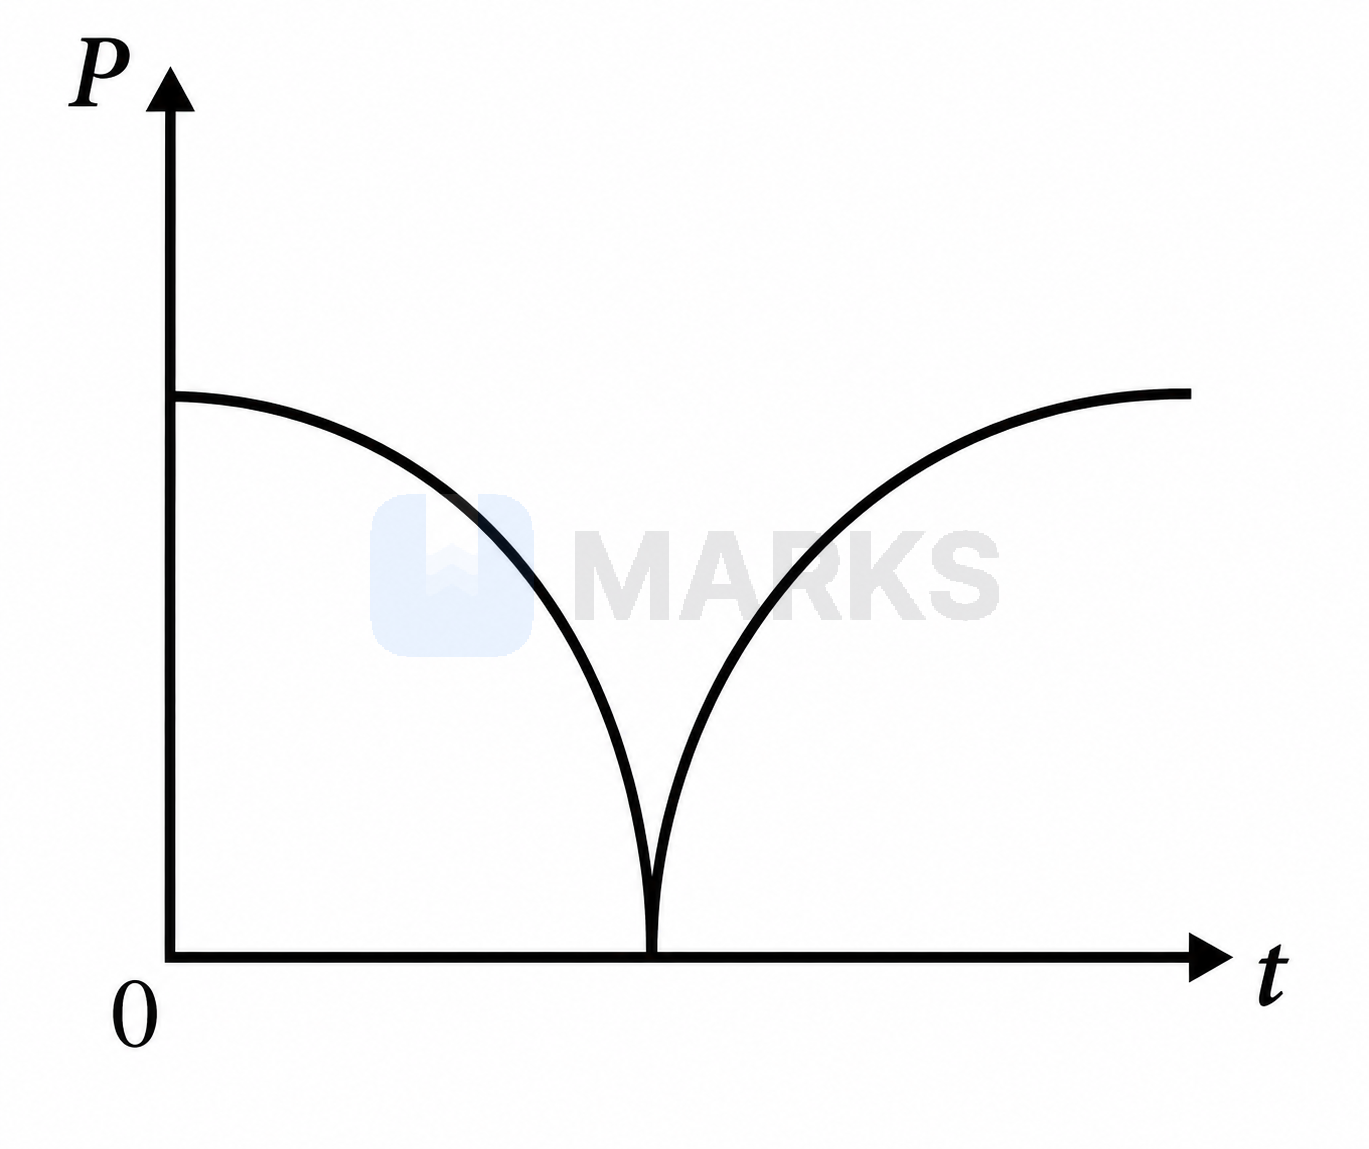
- D
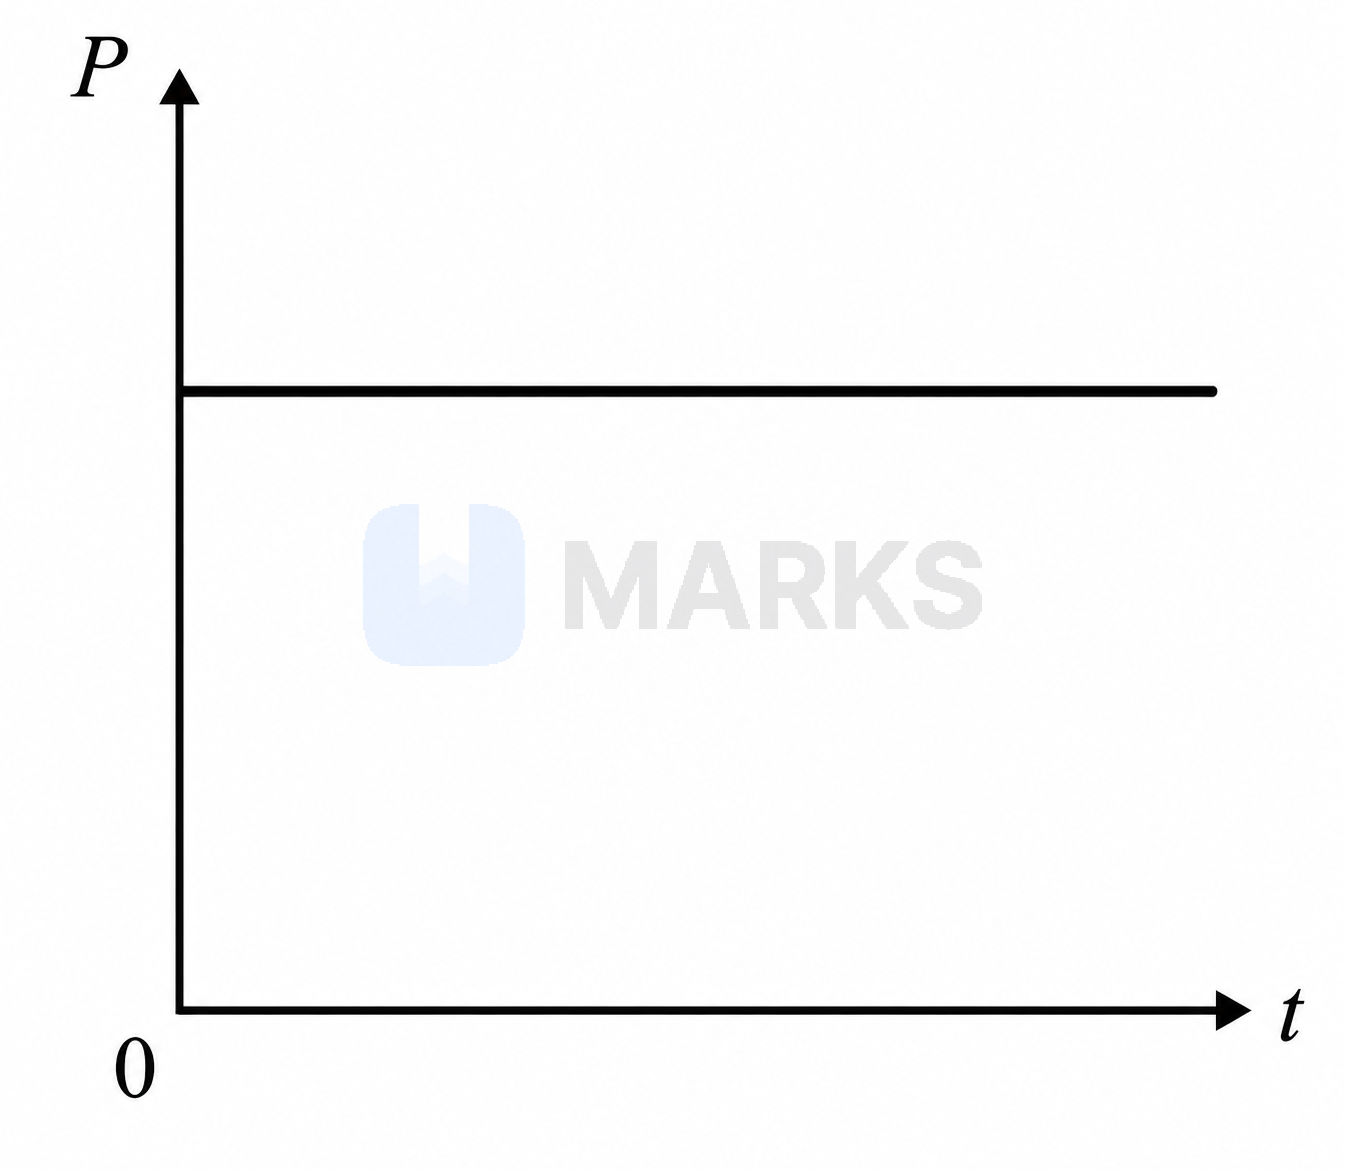
Solution
The magnetic flux passing through the loop is given by:
$\Phi = B \cdot A$
Given that the area varies with time as $A = A_0(1 + \sin t)$ and the magnetic field $B$ is constant, the flux is:
$\Phi = B A_0(1 + \sin t)$
According to Faraday's law of electromagnetic induction, the induced emf $\varepsilon$ is:
$\varepsilon = -\dfrac{d\Phi}{dt} = -B A_0 \dfrac{d}{dt}(1 + \sin t) = -B A_0 \cos t$
The power $P$ dissipated in the loop of resistance $R$ is:
$P = \dfrac{\varepsilon^2}{R} = \dfrac{(-B A_0 \cos t)^2}{R} = \dfrac{B^2 A_0^2}{R} \cos^2 t$
From this expression, we can see that the power $P$ varies as $\cos^2 t$.
At $t = 0$, $P = \dfrac{B^2 A_0^2}{R} \cos^2(0) = \dfrac{B^2 A_0^2}{R}$ (which is a maximum value).
At $t = \dfrac{\pi}{2}$, $P = 0$.
The graph of $P$ versus $t$ will start from a maximum positive value, decrease to zero, and then increase again, oscillating between $0$ and a maximum value. This behavior is correctly represented by the graph in option (3).
Answer:
Hence, the correct answer is option: 'C'.